애니메이션 효과가 있는 차트, 그래프 그리기 chart.js(v4.4.3) 플러그인 사용법
목차
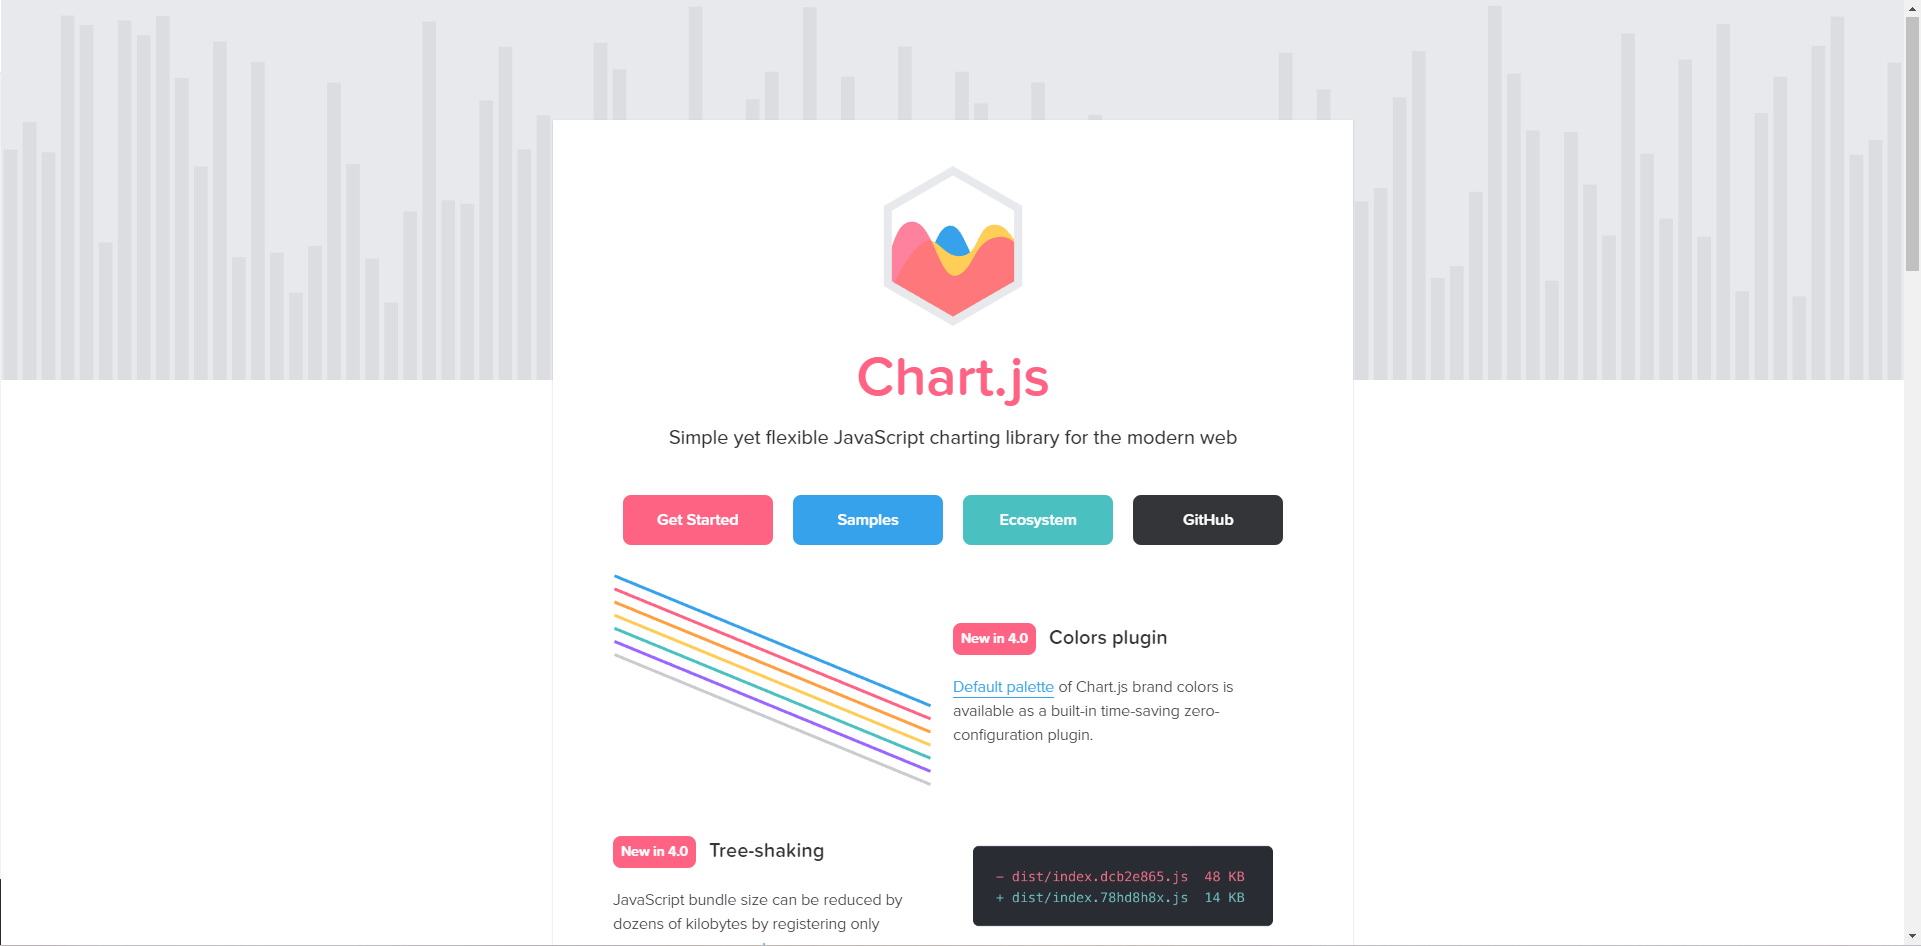
chart.js
다양한 차트를 쉽게 생성하고 커스터마이즈 할 수 있다. 반응형이며 MIT라이선스로 오픈소스이다. 자주 사용되는 차트 유형, 플러그인을 제공하고 사용자가 직접 정의 할 수 있다. 기본 제공 차트 유형 세트 외에도 커뮤니티에서 유지 관리하는 추가 차트 유형을 사용할 수 있다. 여러 차트 유형을 결합할 수 있다. 주석 생성, 확대/축소, 드래그 앤 드롭 기능 등 다양한 기능을 제공한다.
chart.js 사용법
HTML, JavaScript를 사용하여 chart.js를 구현할 수 있다.
라이브러리 추가하기
<head></head> 태그 사이에 입력한다.
<head>
    <script src="https://cdn.jsdelivr.net/npm/chart.js"></script>
</head>
파일 직접 다운로드하기 https://github.com/chartjs/Chart.js/releases/tag/v4.4.3
html 작성하기
<body></body> 태그 사이에 입력한다
<body>
    <div>
      <canvas id="myChart"></canvas>
    </div>
</body>
js 작성하기
<script></script> 태그 사이, 또는 외부 scipt파일에 입력한다
const ctx = document.getElementById('myChart');

new Chart(ctx, {
    type: 'bar',
    data: {
      labels: ['Red', 'Blue', 'Yellow', 'Green', 'Purple', 'Orange'],
      datasets: [{
        label: '# of Votes',
        data: [12, 19, 3, 5, 2, 3],
        borderWidth: 1
      }]
    },
    options: {
      scales: {
        y: {
          beginAtZero: true
        }
      }
    }
});
그래프종류
type: 'bar'
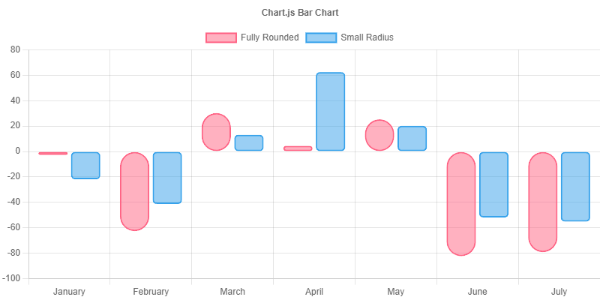
샘플보기 https://www.chartjs.org/docs/latest/samples/bar/border-radius.html
type: 'line'
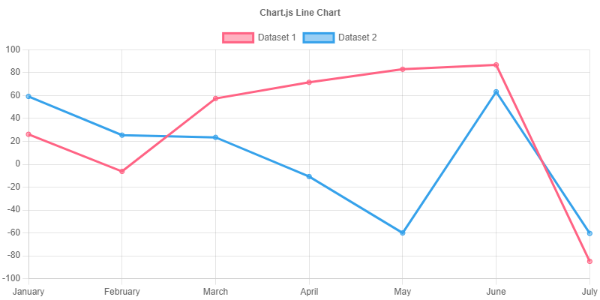
샘플보기 https://www.chartjs.org/docs/latest/samples/line/line.html
type: 'bubble'
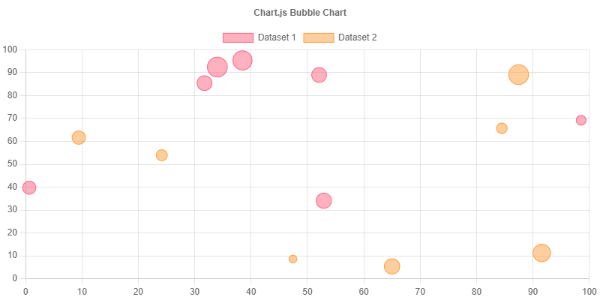
샘플보기 https://www.chartjs.org/docs/latest/samples/other-charts/bubble.html
type: 'doughnut'
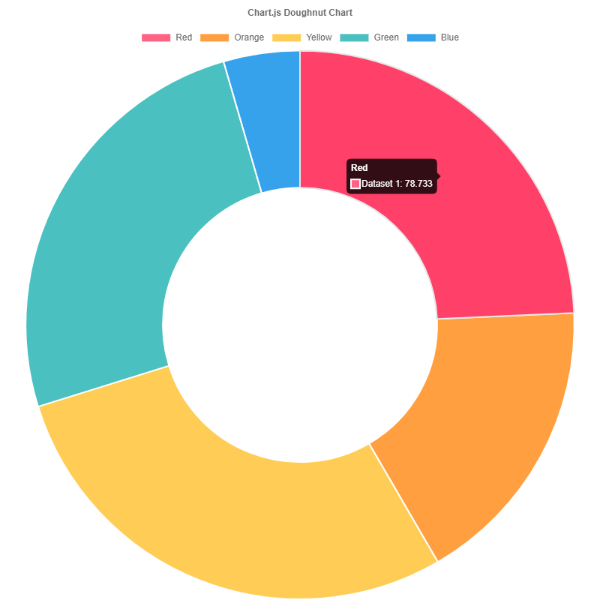
샘플보기 https://www.chartjs.org/docs/latest/samples/other-charts/doughnut.html
type: 'pie'
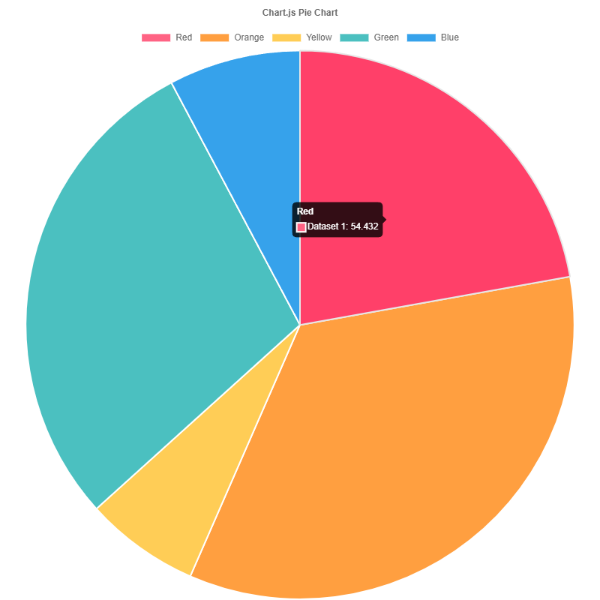
샘플보기 https://www.chartjs.org/docs/latest/samples/other-charts/pie.html
type: 'polarArea'
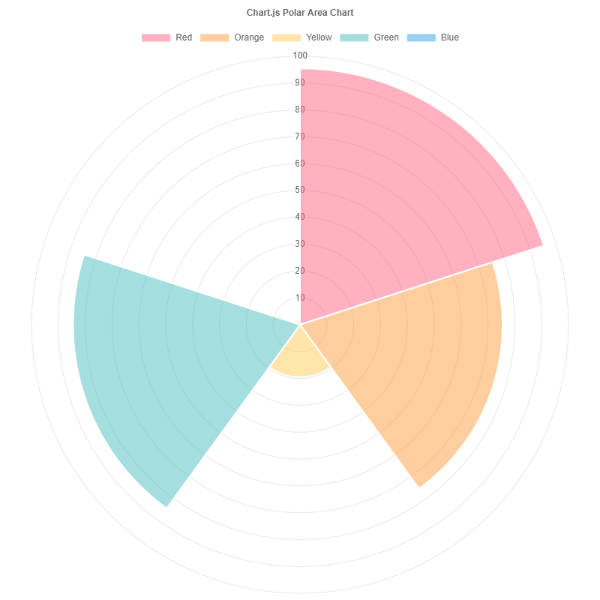
샘플보기 https://www.chartjs.org/docs/latest/samples/other-charts/polar-area.html
type: 'radar'
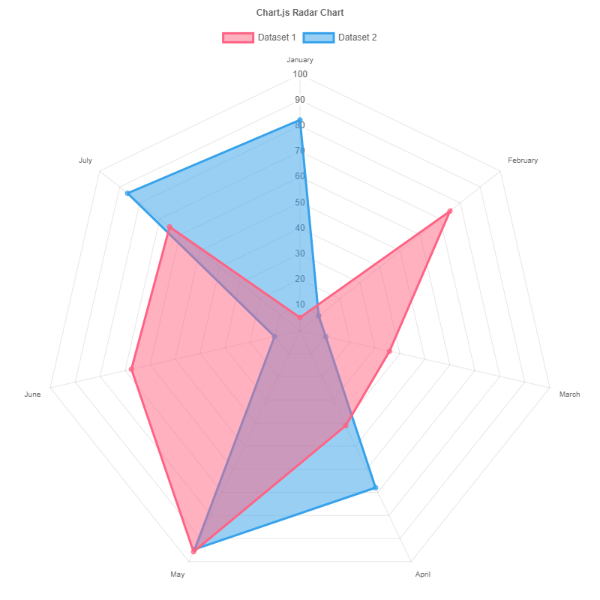
샘플보기 https://www.chartjs.org/docs/latest/samples/other-charts/radar.html
type: 'scatter'
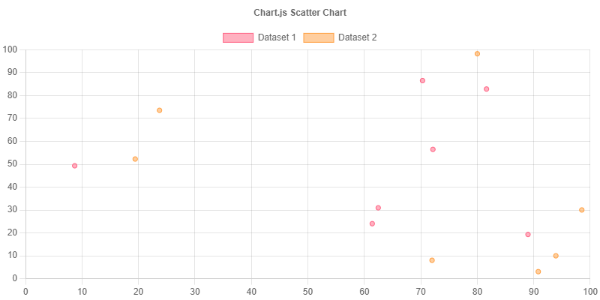
샘플보기 https://www.chartjs.org/docs/latest/samples/other-charts/scatter.html
참고사이트
Chart.js
Simple yet flexible JavaScript charting library for the modern web
www.chartjs.org